21 Oct 2026
Mapping Production Shifts in Specialty Foam Development Through Historical Benchmarks
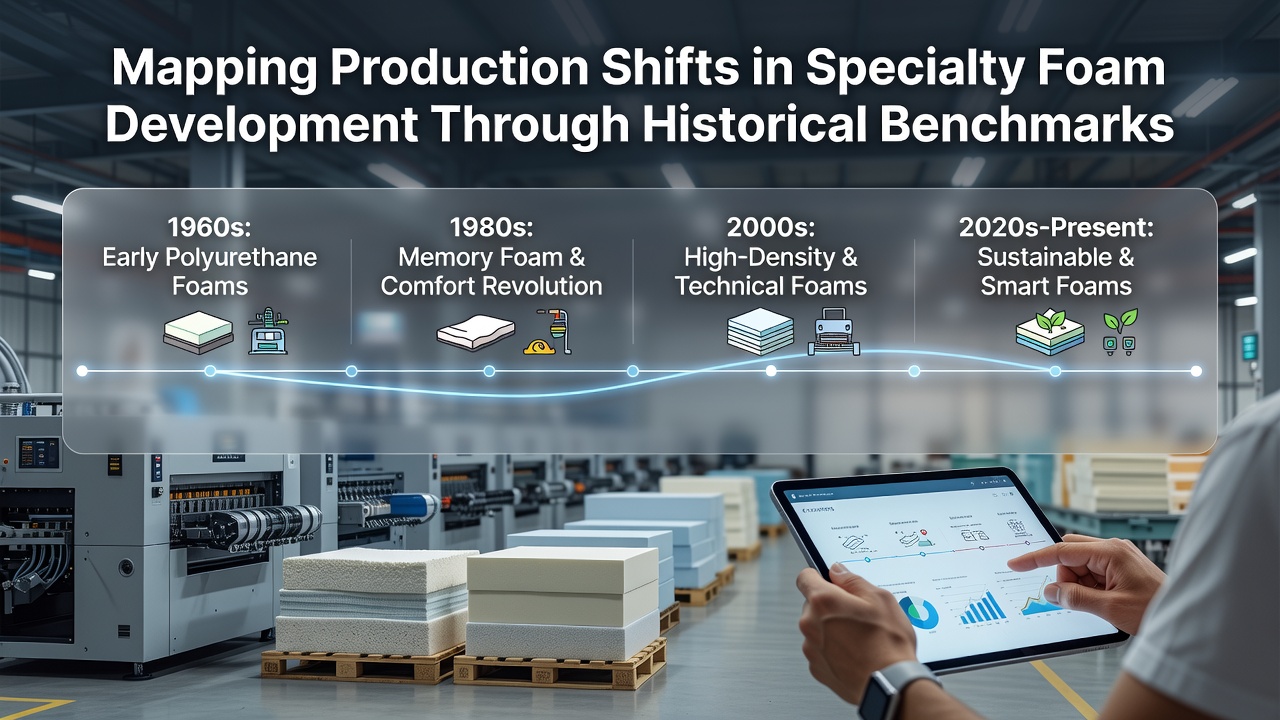
Specialty foam production has undergone repeated transformations since the mid-twentieth century, and researchers track these changes through layered benchmarks that record shifts in raw materials, processing techniques, and output volumes. Early methods centered on batch mixing of polyurethane precursors, yet facilities began adopting continuous extrusion lines by the 1970s because those systems delivered steadier density profiles across larger runs. Data collected from that era show average cell sizes dropping from 300 microns to under 150 microns as mixing pressures rose and catalyst formulations changed.
Early Industrial Benchmarks and Material Transitions
Industry records from the 1980s document a clear move away from chlorofluorocarbon blowing agents after initial environmental studies linked them to atmospheric ozone depletion. Manufacturers replaced those agents with water and carbon dioxide systems between 1987 and 1995, while production yields remained stable because equipment upgrades occurred in parallel. Figures compiled by the U.S. Environmental Protection Agency indicate that energy consumption per cubic meter of foam fell roughly 18 percent during the same window once heat-recovery units entered standard use.
By the early 1990s, quality-control protocols incorporated real-time ultrasonic scanning that replaced manual core sampling, and defect rates declined measurably across multiple plants. Those protocols later served as the foundation for ISO 9001 certifications that many specialty foam lines obtained between 1998 and 2002.
Automation and Supply-Chain Adjustments After 2000
Automation accelerated after 2000 when servo-driven cutting tables replaced hydraulic models, allowing tighter tolerance on finished dimensions. Production data from that period reveal cycle times shortening by 22 percent on average, while scrap percentages dropped below 4 percent in facilities that integrated the new equipment. Supply chains also diversified because several key polyol suppliers expanded capacity in Asia, and logistics records show freight volumes shifting accordingly by 2008.
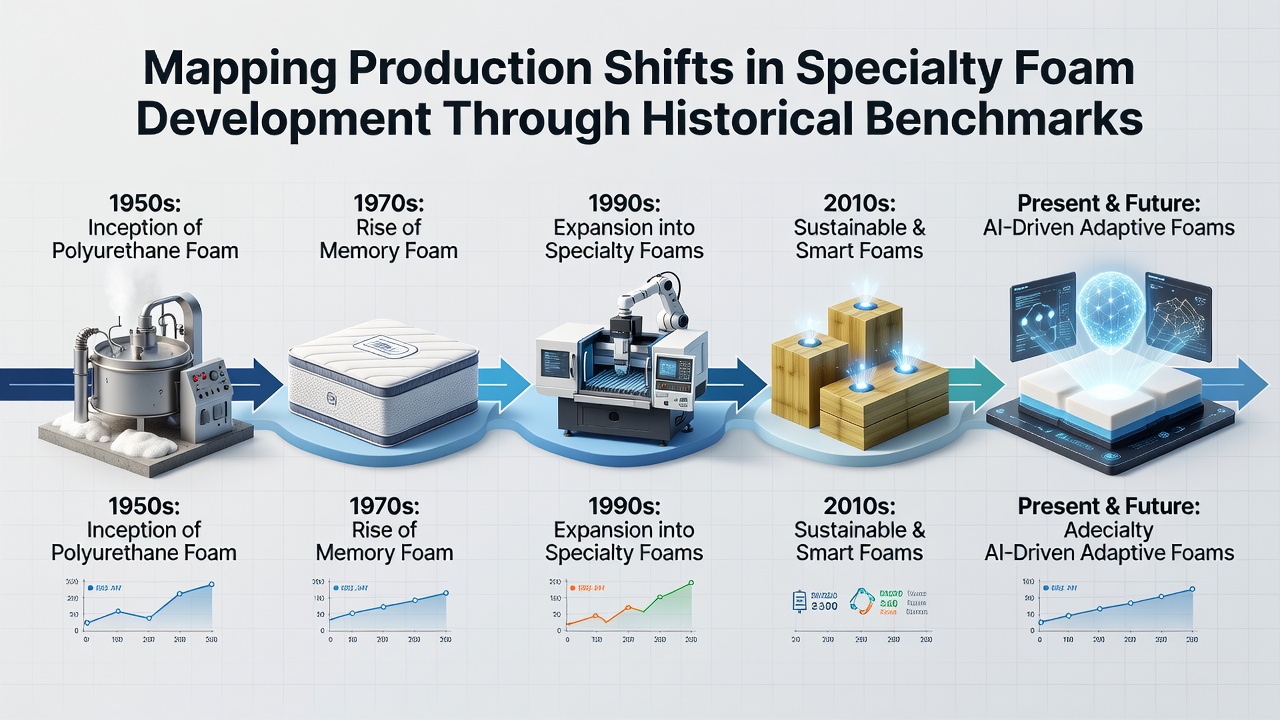
European Chemicals Agency guidelines introduced in 2010 prompted further reformulation of flame-retardant packages, and subsequent testing confirmed that new additive blends maintained compression-set values within previously established limits. Plants that completed the transition reported consistent compliance during audits conducted through 2015.
Recent Developments and Data Through 2026
More recent benchmarks focus on digital monitoring and closed-loop control systems installed after 2018. Sensors now track temperature, pressure, and viscosity at multiple points along the production line, feeding adjustments directly into programmable logic controllers. Output statistics collected through 2024 show throughput increases of 15 percent alongside a 9 percent reduction in off-spec material compared with 2017 baselines. Observers note that these gains coincide with broader adoption of bio-based polyols that now constitute up to 30 percent of feedstock in select lines.
Industry reports scheduled for release in October 2026 are expected to incorporate fresh metrics on recycled-content foams and their long-term performance under repeated compression cycles. Preliminary summaries already circulated among trade groups indicate that certain formulations achieve recovery rates above 92 percent after 50,000 cycles, matching or exceeding virgin-material benchmarks established in 2012. Academic studies from Canadian research institutions have corroborated these trends through independent laboratory trials conducted over the past three years.
Conclusion
Historical benchmarks therefore map a continuous refinement process rather than abrupt revolutions. Each decade introduced measurable adjustments in chemistry, machinery, and oversight that together raised efficiency and narrowed performance variability. Current data streams continue to feed the same mapping exercise, and the October 2026 reports will simply add one more layer to an already detailed record of production evolution in specialty foam development.